DATA CAN BE FUN!
At Giant Punch, we believe that even in data, there’s an opportunity for creativity and joy. Say goodbye to dull Excel sheets and lifeless PowerPoint presentations; our passion lies in turning mundane data into a lively visual experience. Inspired by ancient hieroglyphics and petroglyphs, we simplify complex information using glyphs and images, weaving a compelling narrative.
SKETCH AWAY
Our process kicks off with a deep dive into the data we receive from clients. We break it into digestible chunks, creating vector images or utilizing high-resolution pictures from the outset. This ensures your graphics are visually appealing and scalable to any size without compromising quality. We get down to sketching out the idea right away!
KEEP’N IT SIMPLE
The goal is to communicate a wealth of data in a simple, easy-to-understand manner. Our infographics are designed with ample whitespace, preventing information overload and ensuring a smooth, enjoyable reading experience. We prioritize minimal text, allowing essential details to shine.
ACCOLADES
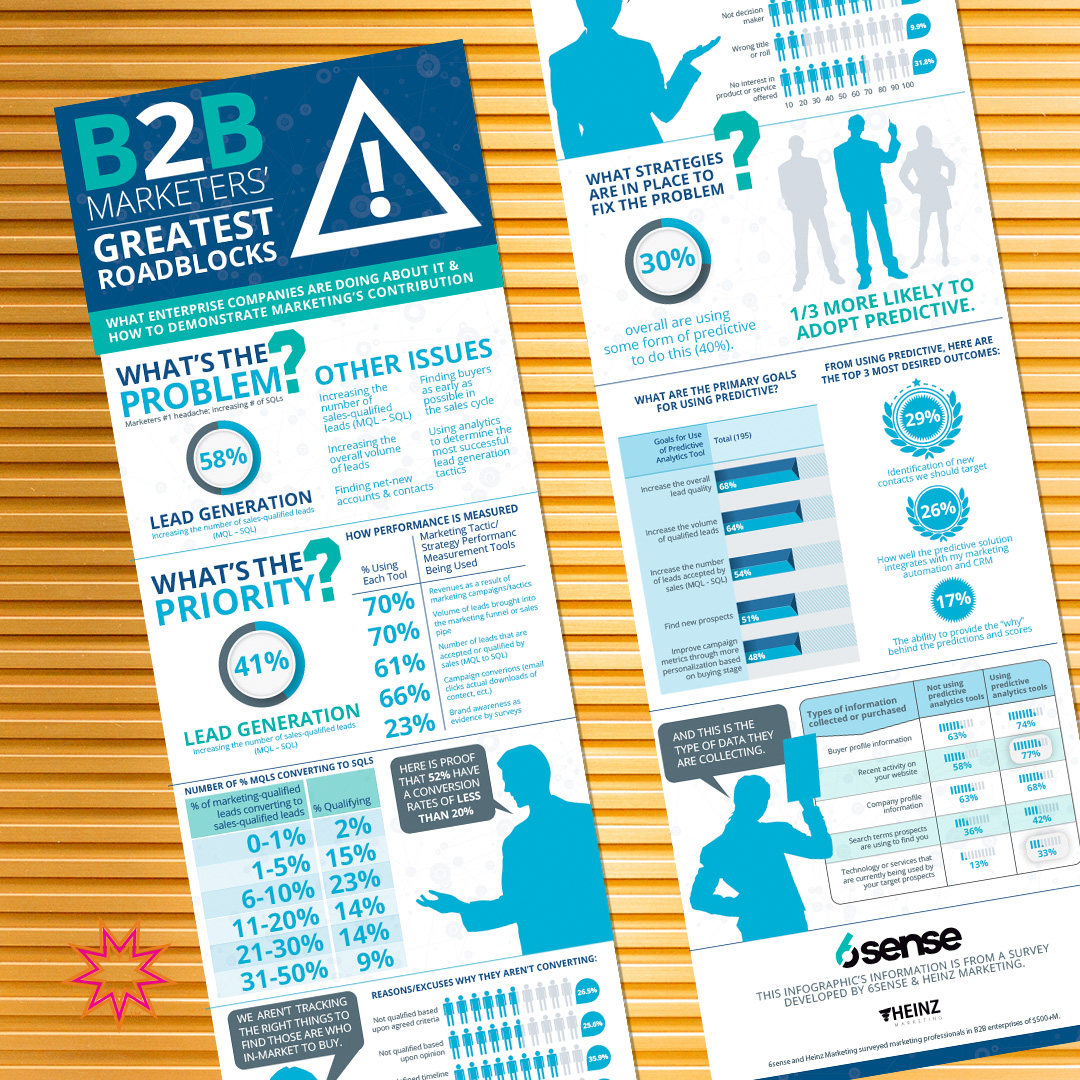
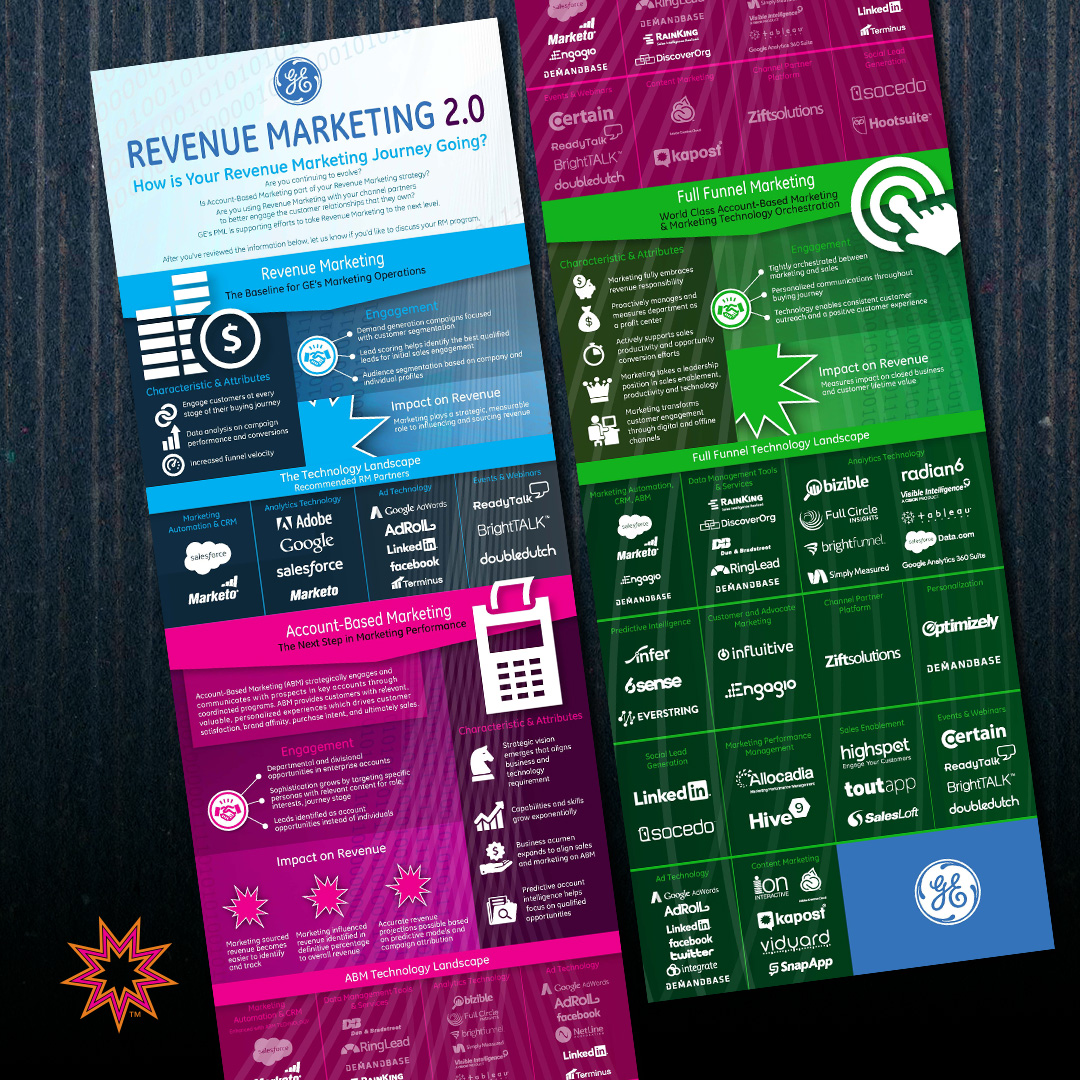
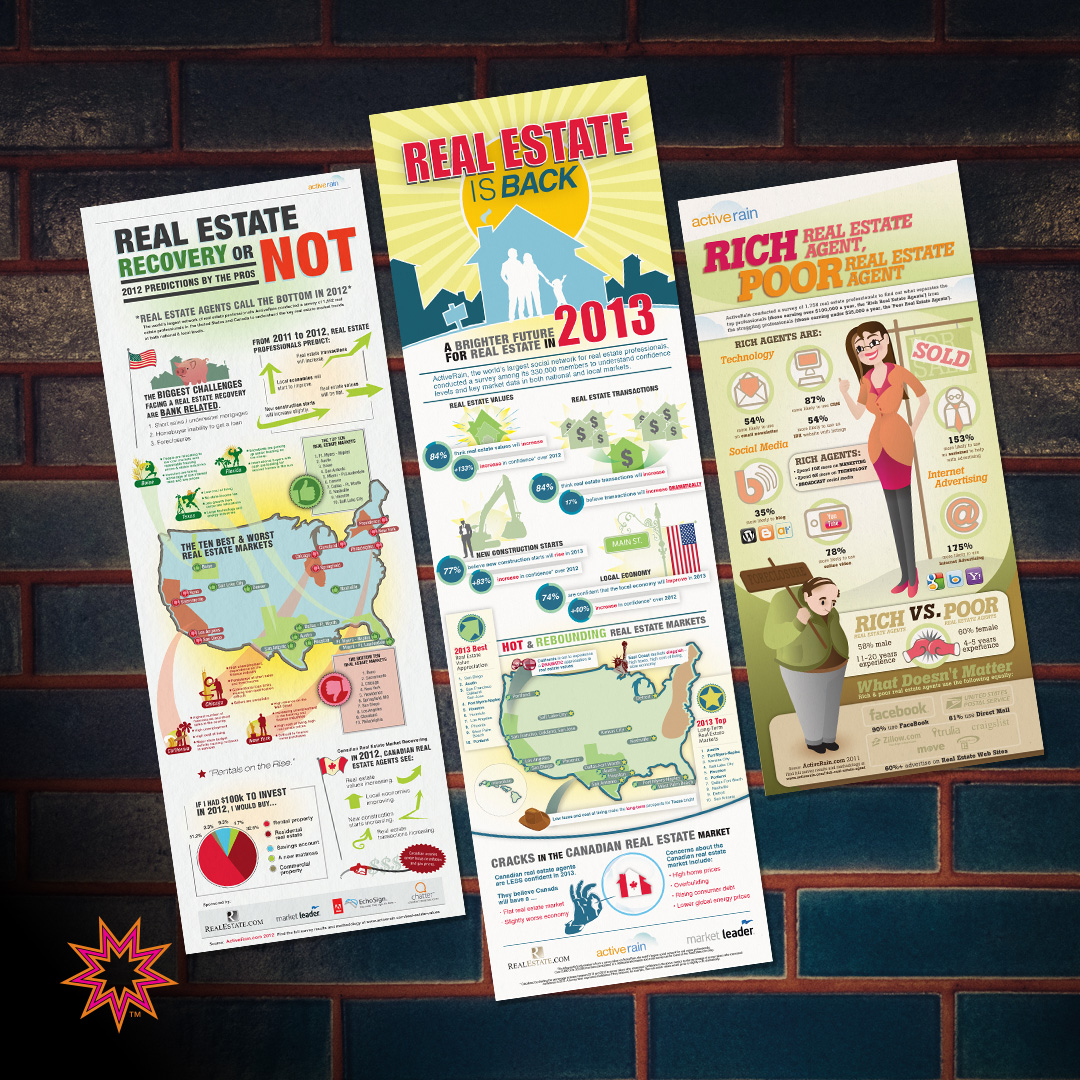
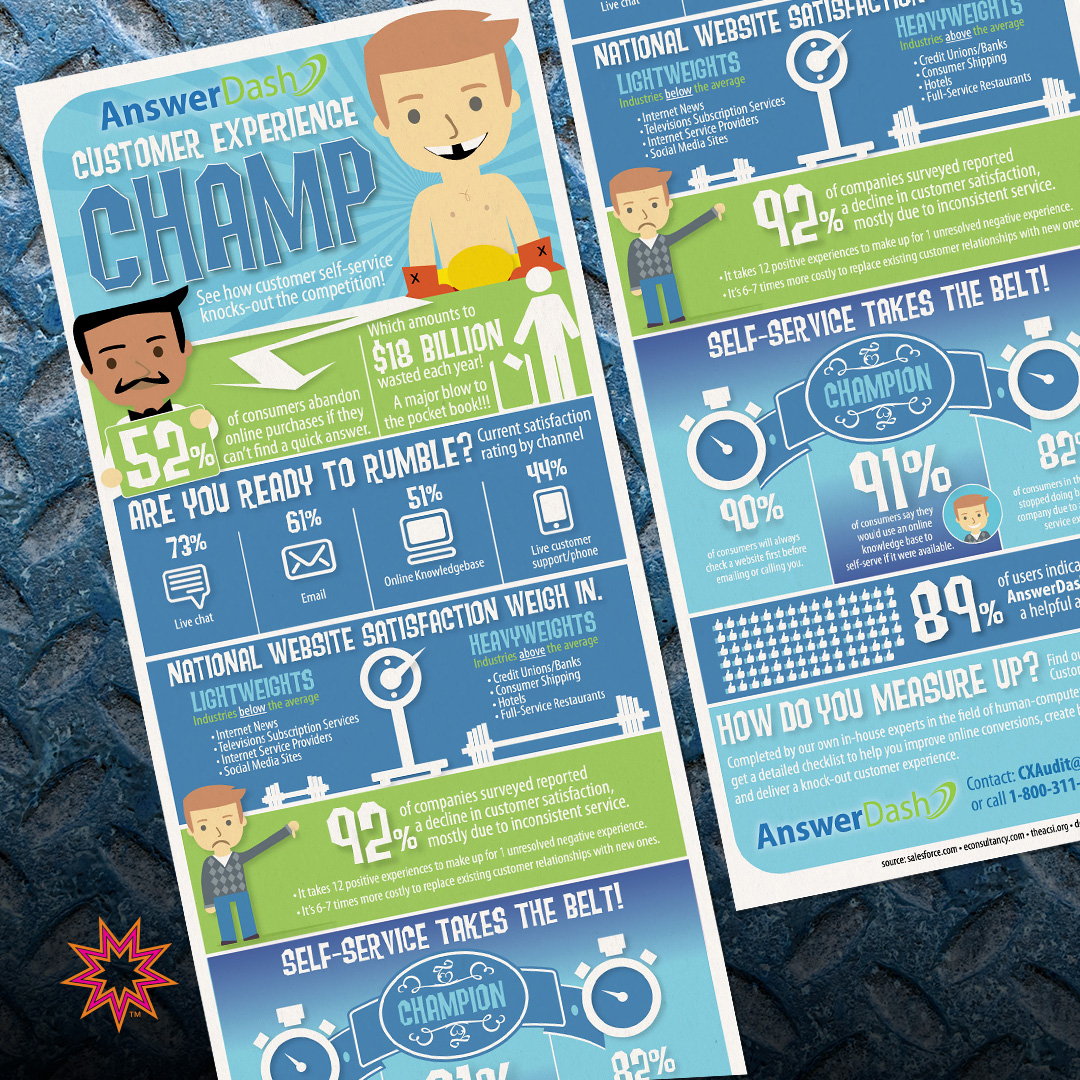
Our portfolio includes infographics crafted for various clients, from dynamic start-ups to industry giants like General Electric and Boeing. Whether you’re a real estate leader or a budding entrepreneur, every infographic receives the same meticulous attention, making an impactful visual statement.
FACTS & INFO
What is an Infographic? Infographics visually communicate complex data in a format that’s easy to read and understand. They engage the viewer through illustrations, icons, and data visualizations, making them practical tools for conveying information.
Why Infographics Matter:
- Processing Information: Humans process visual information 60,000 times faster than text, making images more memorable.
- Information Overload: In a world of information overload, infographics stand out as a relief, offering easily digestible content.
- Communicating with Digital Natives: Millennials prefer brief, instantaneous messages, making infographics an ideal medium.
- Easily Shareable: Infographics are highly shareable on social media, ensuring your crucial message reaches a broader audience.
Elements of an Infographic:
Data Visualizations: Showcase patterns and trends in data.
Images and Symbols: Engaging visuals related to the topic.
Small Amounts of Text: Avoid overwhelming the viewer with excessive text.
Color: Use color strategically to draw attention.
Creating an Infographic:
Preparation: Define the aim and critical messaging.
Planning: Outline content addressing objectives.
Development: Use appropriate software for creation.
Evaluation: Assess storytelling, data quality, and visual style.
Publication/Dissemination: Ensure easy sharing for effective message dissemination.
Evaluating an Infographic:
Criteria 1: Does it tell a story?
Criteria 2: Does it use excellent/valuable data/information?
Criteria 3: Does the visual style help/hinder understanding the story?
Ready to bring life to your data? Connect with Giant Punch, and let’s craft infographics that tell compelling stories.
View our Giant Portfolio!
Brand Consulting
NOW AVAILABLE!
Ready to elevate your brand to new heights? In addition to our exceptional logo design services, we offer Brand Consulting to ensure that your brand's story and identity are as compelling as your logo. Let's embark on a transformative journey that aligns every aspect of your brand for unparalleled success.

Infographic Design